The x- and y-axes break the plane into four regions called quadrants, named using Roman numerals I, II, III, and IV. The ordered pair (x, y) represents the position of points relative to the origin. A few ordered pairs are plotted below:
This system is often called the Cartesian coordinate system, named after the French mathematician René Descartes (1596–1650). Read about him on Wikipedia, he was a very interesting person!
A linear equation has standard form,
ax + by = c
where a, b, and c are real numbers and a and b are not both zero. With numbers a linear equation looks like,6x − 3y = 12
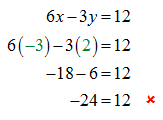
Solutions to linear equations are ordered pairs (x, y) where the coordinates, when substituted into the equation, produce a true statement. For example, to show that (3,2) and (−2, −8) are solutions substitute and then simplify:Here we can see (3, 2) and (−2, −8) are solutions to the equation. From geometry we know that two points determine a line. So at this point we can plot these points and then draw a line through them. The line represents all ordered pair solutions and is called its graph.
We have graphed our first line!
Tip 1: The scale on the x-axis does not need to match the scale on the y-axis. Choose a scale that is convenient. In this case, each tick on the y-axis represented 2 units. However, when you do this you need to be careful when plotting the points.
Tip 2: You do not really need graph paper, but it sure does help. Go to Google and search “free printable graph paper.” Or visit OpenAlgebra.com and click on the link to printable graph paper on the right and print some out.
Tip 3: Use a straightedge – a ruler or ATM card. All lines are straight, do not try to freehand them especially when accuracy is important.
Notice that (−3, 2) is not on the line and so these coordinates should not solve the equation.
Now, the question is, “how did we get those points?” Read [ Graphing Lines by Plotting Points ] and you will see.
---


comment 0 التعليقات:
more_vertsentiment_satisfied Emoticon