When graphing an equation like
y = 3
x − 6 we know that it will be a line. The graph of a linear inequality such as
y >= 3
x − 6, on the other hand, gives us a region of ordered pair solutions.
Not only do the points on the line satisfy this linear inequality - so does any point in the region that we have shaded. This line is the boundary that separates the plane into two halves - one containing all the solutions and one that does not. Therefore, from the above graph, both (0, 0) and (−2, 4) should solve the inequality.
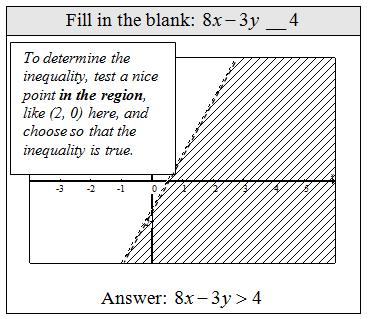
Use a test point not on the boundary to determine which side of the line to shade when graphing solutions to a linear inequality. Usually the origin is the easiest point to test as long as it is not a point on the boundary.
Graph the solution set.
If the test point yields a true statement shade the region that contains it. If the test point yields a false statement shade the opposite side.
When graphing strict inequalities, inequalities without the equal, the points on the line will not satisfy the inequality; hence, we will use a dotted line to indicate this. Otherwise, the steps are the same.
Graph the solution set.
Given the graph determine the missing inequality.Video Examples on YouTube:


comment 0 التعليقات:
more_vertsentiment_satisfied Emoticon