Here are some examples:
Evaluate.
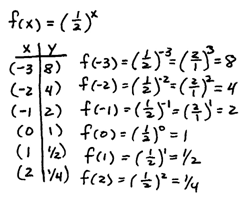
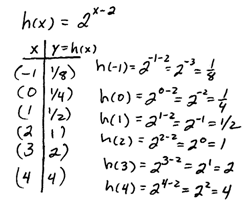
When asked to graph these types of functions we plot points.
Step 1: Choose any values for x. Choose some negative values, zero, and some positive values.
Step 2: Evaluate to find the corresponding y-values.
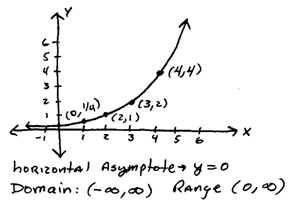
Step 3: Plot the points. The points you plot the better the graph will look.
Notice that the y-values can never actually attain zero. They get infinitely close when x is negative so the graph will be asymptotic to the x-axis. In other words, the line y = 0 is a horizontal asymptote.
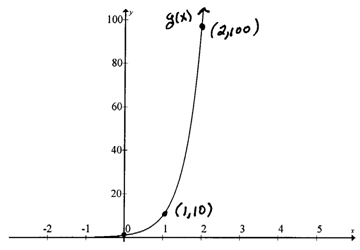
Looking at the two previously graphed exponential functions on the same set of axes we will be able compare their rates of growth.Instructional Video: Graph Exponential Functions
Notice that for positive values of x, g(x) increases more rapidly than f(x). Also the domain and range for the two functions are the same. In addition, they are both asymptotic to the x-axis (or y = 0) and they both have the same y-intercept (0, 1). Now we will explore exponential functions with bases greater than zero but less than 1.
Tip: All exponential functions of the form y = b^x have (0, 1) as a y-intercept, no x-intercept, and the x-axis will be a horizontal asymptote.
Looking at the two exponential two previous exponential functions on the same set of axes we will be able compare their rates of growth.
Notice that g(x) decreases more rapidly than f(x). Also the domain, range, and y-intercept for the two functions are the same.
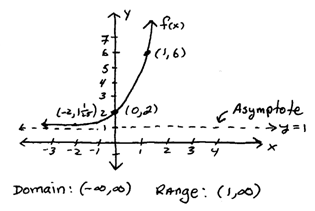
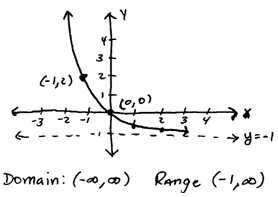
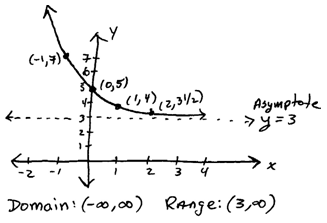
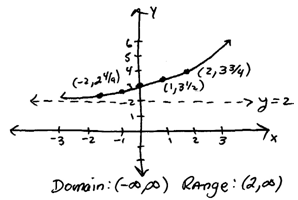
Tip: All exponential functions of the form y = b^(x+h) + k have a horizontal asymptote at y = k.
It is also useful to note the rigid transformations in the above graphs. In the previous example the basic graph of y = 3^x was shifted down two units and to the left 1 unit.
Notice that all of the exponential functions graphed above pass the horizontal line test. Therefore we may conclude that they are all one-to-one and have an inverse. This is one of the most important observations of this section. We will define the inverse of these functions in subsequent sections.
A common error when stating the range is to include the y-value that defines the asymptote. In the previous problem one might think the range is [ 2, inf ) but this is incorrect. The y-values get infinitely close to 2 but never actually attain that value – this is what it means to be asymptotic. So the range is ( 2, inf ).
YouTube Videos:
















comment 0 التعليقات:
more_vertsentiment_satisfied Emoticon