Identity Function: [ https://www.desmos.com/calculator/hbtql3gmj4 ]
Graph f(x) = x and state the domain and range.


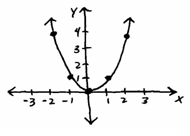
Graph f(x) = x^2 and state the domain and range.


Cubing Function: [ https://www.desmos.com/calculator/g0uxyuv08i ]
Graph f(x) = x^3 and state the domain and range.


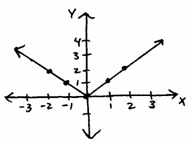
Graph f(x) = | x | and state the domain and range.


Square Root Function: [ https://www.desmos.com/calculator/hwrrzgp3x2 ]
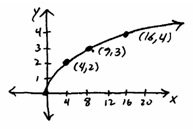
Graph f(x) = sqrt(x) and state the domain and range.


Reciprocal Function: [ https://www.desmos.com/calculator/wl1xlsmgfs ]
Graph f(x) = 1/x and state the domain and range.


comment 0 التعليقات:
more_vertsentiment_satisfied Emoticon